
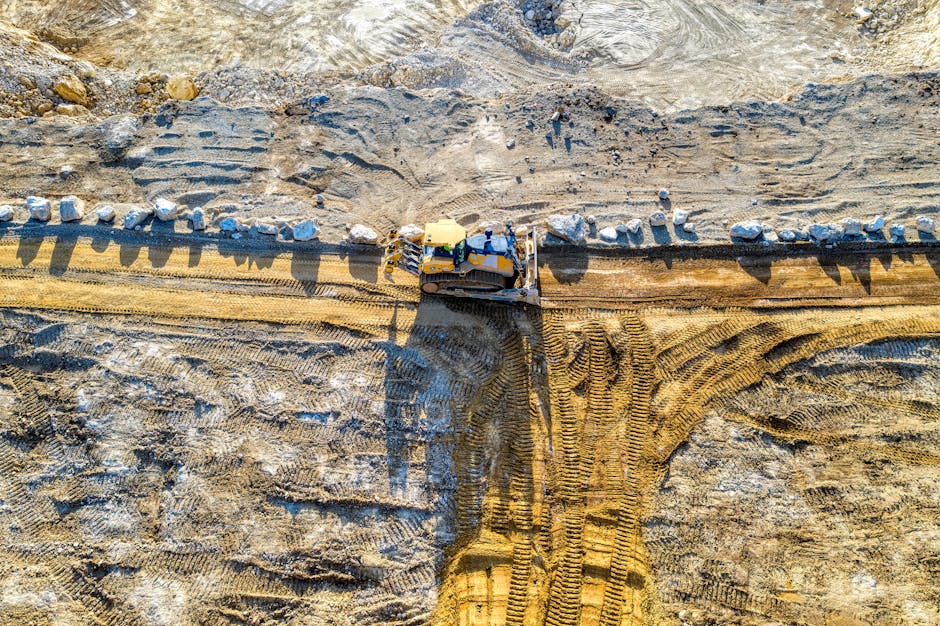
From Grading to Transport: How to Estimate Time and Cost Using Practical Tech Metrics (Including Equipment Specs)
If you’ve ever priced a job and then watched the timeline slip by two weeks, you already know the real problem isn’t “work ethic.” It’s estimating with the wrong numbers. The fix is simpler than most people think: use practical tech metrics, tie them to equipment specs, and build a realistic plan for grading and transport.
In this guide, I’ll show you how I estimate time and cost from the first site notes through hauling. You’ll learn the metrics that matter (production rate, swell factor, cycle time, idle time) and how to convert equipment specs into a working estimate. You’ll also see a real-world example using compact equipment and how to sanity-check the math.
Primary keyword: From grading to transport: how to estimate time and cost using practical tech metrics (including equipment specs). I’m using that exact idea because it matches what most people search for when they’re planning a build and trying to avoid budget blowups.
Quick answer: the fastest way to estimate time and cost (grading → transport)
Estimate earthwork using three numbers: how many cubic yards (or cubic meters) you need to move, your production rate from real equipment specs, and your truck haul capacity after swell and downtime. Then add an “idle tax” for waiting on loaders, turning, and weather breaks. That combo gives you a working timeline you can actually defend.
Key definitions you can use in your estimate
Production rate is how much material an exact machine can move in an hour on a real job, not in a brochure. Swell factor is how much volume increases after digging (loose soil takes more space). Cycle time is how long it takes for a machine to load, move, dump, and return.
Start with the site data: tech metrics that stop bad guesses
The best estimates don’t start with a price. They start with measurement. When I’m on a site, I focus on mapping the work into small pieces: cut depth zones, haul distance bands, and accessibility limits for trucks.
What to measure (and why it changes the cost)
These are the inputs that decide your production rate and your truck count. If you skip any one of them, your numbers usually drift in the wrong direction.
- Mass/volume needed: cubic meters (m³) or cubic yards (yd³). Use a volume takeoff from drawings, laser scanning, or simple drone + contour maps.
- Cut vs fill split: cut material needs loading and hauling; fill needs spreading and compaction. The plan changes.
- Average lift: average depth for excavation. Bigger lift often means different bucket loading and longer cycles.
- Haul distance: not just “site to dump.” Include turn time and grade (upslope costs real time).
- Access: truck width, turning radius, gate limits, and ground bearing for staging.
- Soil type: clay vs sand matters because it changes swell and how easily the bucket curls.
A practical method I use: break the job into “bands”
Instead of one big average haul distance, split into distance bands like 0–30 m, 30–60 m, 60–120 m. Even a rough split reduces over-optimism because small changes in distance can double cycle time.
Convert equipment specs into production rate (not “feel”)
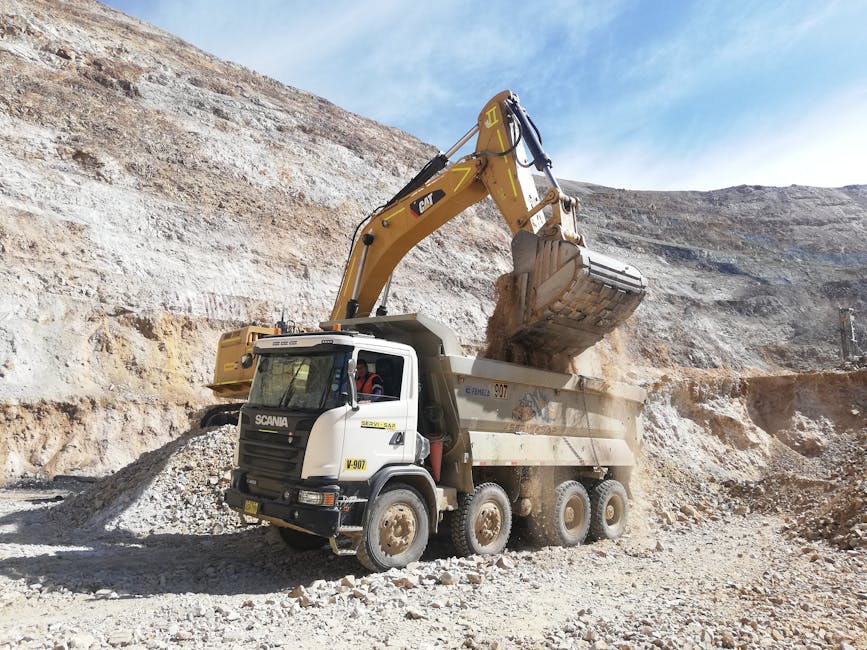
Here’s the part most people get wrong: they look at bucket size and assume it’s your hourly output. It’s not. Output comes from cycles, loading conditions, and bucket fill factor.
Use bucket fill factor and cycle time together
Bucket size is only the starting point. The fill factor is how full you get in real digging. In rocky soil you might get 0.8 of rated capacity; in loose sand you might get 1.05 because it slumps. That changes volume moved per cycle.
Simple production estimate formula: Production (m³/hour) ≈ (bucket volume × fill factor × cycles per hour) × material adjustment (swell/looseness if you’re counting bank vs loose).
Where to get cycle time inputs
If you don’t have job history, do a fast field check. Watch the operator work the same distance and lifting height for 10–15 minutes. Count cycles and estimate a typical cycle time. Then adjust for longer trips and reposition time.
Example: translating specs into a real estimate
Let’s say you’re using a compact wheel excavator for grading and moving topsoil. You have a bucket rated at 0.18 m³. In real conditions, your fill factor averages 0.95. If your measured cycle time is 45 seconds for short pushes and 60 seconds for longer moves, cycles per hour are:
- 45 s cycle → 80 cycles/hour
- 60 s cycle → 60 cycles/hour
Loose volume moved per hour:
- Short area: 0.18 × 0.95 × 80 ≈ 13.7 m³/hour
- Longer haul: 0.18 × 0.95 × 60 ≈ 10.3 m³/hour
Now add an adjustment for job realities. If you lose 15–25 minutes/hour to repositioning, toolbox time, and waiting, multiply by a utilization factor like 0.75–0.85. For the longer haul case, using 0.8 utilization:
10.3 × 0.8 ≈ 8.2 m³/hour. That’s the number you should compare to your volume takeoff.
Account for swell, shrink, and “why trucks look short”
Transport costs explode when your volume math is wrong. The most common mistake is mixing bank volume (what’s in the ground) with loose volume (what’s in the truck). You have to pick one and stick to it.
Swell factor: the missing line item
Swell factor is the percent increase in volume after excavation. As a simple rule of thumb for estimating:
- Loose sand: swell about 1.15–1.25
- Clay/silty soils: often 1.05–1.15
- Hard packed or mixed material: can be 1.20+ after breaking
So if your drawings show 200 m³ bank volume, and you assume swell 1.12, your loose volume is 224 m³. That’s more truck trips than you planned.
Truck load capacity: use volume, not just weight
Many trucks look “full” but you still hit weight limits. In some regions and permits, weight rules are stricter than volume. If you only plan by volume, you end up under-loading and losing time on extra trips.
Also include a practical loading efficiency. If your loader can’t pack material well (wet soil, sticky clay), the effective payload might be 90–95% of the rated capacity.
What I do when the numbers don’t match
If your truck count is way higher than expected, it’s usually one of these:
- Haul distance underestimated (grade + turns matter).
- Swell applied twice (or not at all).
- Utilization ignored (waiting at the dump or loading queues).
- Material type mismatch (clay acting like heavy chunks).
Build the transport plan: trucks, cycle time, and waiting losses
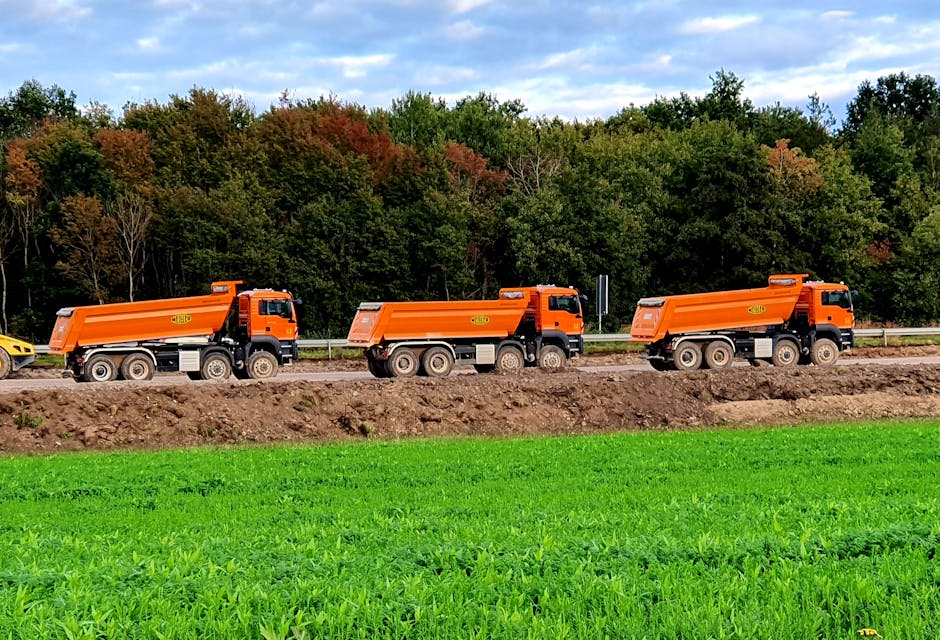
Transport is a “matching game” between loading equipment and truck cycles. If the loader is faster than the trucks, you waste machine time. If trucks are faster, the trucks waste time and your productivity drops.
Estimate truck cycle time like a stopwatch problem
Truck cycle time includes: load time, travel loaded, dump/spotting time, travel empty, and any waiting. Even good operators can add 30–90 seconds of spotting delays on uneven ground.
Build this as:
- Load time: depends on loader/hoe cycle + truck position.
- Loaded travel time: distance + speed + grade.
- Dump time: gate opening, tipping, and clearing.
- Empty travel time: often faster, but don’t assume “instant.”
- Queue/wait: loader stops, or dump is full.
Example: truck count that actually matches loader output
Say your loader output is 8.2 m³/hour (from the earlier example). Each truck carries 8.0 m³ of loose material. Your required truck load rate is 8.2 / 8.0 = 1.03 truck loads per hour.
If the truck cycle time is 30 minutes end-to-end, one truck makes 2 loads/hour. That sounds fine, but you’ll still need extra trucks to cover loading delays. In my experience, you often add 1 extra truck when the site is tight or the dump queue can build up.
Grade and compact: turning production into a finished surface
Grading isn’t just “move dirt.” You’re building layers to a target elevation and preparing for compaction (and later concrete, asphalt, or foundation work). That’s where time and cost often jump.
Use tolerance and rework risk as your hidden cost metric
If you need ±10 mm finish grading, you’ll lose time to re-leveling. The more you chase elevation after compaction, the more you pay in machine hours.
A practical approach: estimate two grading passes. First pass gets you close; second pass corrects low spots. If the site has wet spots or drainage issues, add a third pass.
Compaction is a separate productivity constraint
Compactors (plate, roller, or rammers) have their own output limits. Rolling twice over the same area is normal. If you treat compaction as part of “grading time,” you’ll underestimate.
Measure compaction plan requirements: number of passes, lift thickness, and soil moisture window. Moisture being off by even a small amount can force you to wait for drying or use water trucks.
Comparison: what most people price wrong
| Job step | Common mistake | What to do instead |
|---|---|---|
| Earthmoving | Price by bucket size only | Price by m³/hour using cycle time + fill factor |
| Transport | Use bank volume as truck volume | Apply swell and use consistent loose/bank units |
| Grading | Assume one pass is enough | Plan rework passes based on tolerance |
| Compaction | Ignore moisture window and pass count | Estimate downtime + extra passes |
Equipment specs checklist: what to pull from datasheets before you price
If you want estimates that hold up, you need a short list of spec numbers. I keep it on one page so I don’t forget items when I switch between projects.
For excavation/loader machines
- Bucket or digging implement volume: rated capacity at standard configuration.
- Operating weight: affects ground pressure and access suitability.
- Hydraulic flow/pressure (if listed): impacts digging speed in some soils.
- Reach and dumping height: affects truck loading time and positioning.
- Travel speed: for tracked/utility moves inside the site.
- Powertrain notes: some machines perform worse in cold or in heavy grades.
For compactors
- Compaction method: roller, vibratory, plate, or rammers.
- Operating mass: heavier usually means fewer passes, but it depends on soil.
- Working width: this changes passes per meter.
- Frequency/amplitude (if available): helps match soil type.
For trucks
- Rated payload: weight and legal limit matters.
- Deck/box volume: use for loose material planning.
- Number of axles and restrictions: affects which roads you can use.
- Dump site rules: waiting time can dominate cycle time.
People Also Ask: grading to transport time and cost
How do I estimate grading time if I only have an average soil volume?
Use production rate from a measured cycle time and apply utilization. Start with total volume (m³) and divide by m³/hour. If you know you’ll have two grading passes, double the grading hours estimate, then add compaction hours separately.
What’s the easiest way to estimate transport cost without a truck spreadsheet?
Estimate truck loads: (loose volume needed ÷ effective truck payload). Multiply by average cost per trip or by hourly truck rate, then add waiting time using a simple 10–20% buffer. If the dump queue is common, increase that buffer.
How much does swell factor change the truck count?
It changes it a lot. For example, a 12% swell means you need about 12% more loose volume. Since each truck carries a fixed payload, that usually means roughly 12% more trips—unless you’re hitting weight limits or already under-loaded.
Do equipment specs matter if I’m using quotes from different contractors?
Yes, because specs affect cycle time, access limits, and loading efficiency. Two contractors can both say “we move 1000 m³,” but one might do it with better access and fewer repositioning losses. Specs plus job layout tell you why the hours differ.
A real-world scenario: fast prep for a small construction site
Here’s a scenario I’ve seen often in 2026: a small site needs leveling, a short utility trench zone, and removal of topsoil and poor fill. The customer wants “it done quickly,” but the biggest hidden cost is truck staging.
In one job, the initial estimate used only average haul distance and assumed perfect loader-truck matching. On day two, trucks waited because the loading area was too tight for consistent positioning. We fixed it by shifting the loader angle and adding one additional truck for peak hours. Productivity recovered in two days, and the final cost came down because machine idle time stopped.
This is the original insight I don’t see in generic guides: matching is your real metric. Even if your production rates look great on paper, the site layout decides how often you can hit them.
Where services like bobcatnuoma.eu fit into this planning
If you’re working around Vilnius and need grading, digging, leveling, and transport planning in one workflow, contractors that run consistent equipment make estimates easier to manage. A good example is bobcatnuoma.eu, which focuses on Bobcat work for earthmoving tasks like sklypų lyginimas (plot leveling), grunto kasimas (soil excavation), and transportavimo darbai (transport tasks) within Vilnius and nearby areas. When the same operator set can handle multiple steps, your idle time usually drops because equipment handoffs are cleaner.
That said, your estimate still needs your site metrics. Even with a well-run service, you should request how they measure production on your soil type and haul distance, not just the equipment they plan to use.
Planning for 2026 reality: add weather and digital delays
In 2026, more sites use drones, laser levels, and quick scans. Those tools help, but they also add time for setup, point checks, and re-survey after major changes. Don’t treat “scan time” as zero.
Use a simple buffer that matches real delays
- Weather buffer: add 5–10% if soil gets muddy and trucks rut the ground.
- Coordination buffer: add 5–8% for utilities marks, inspections, or material delivery timing.
- Rework buffer: add 3–7% if tolerance is tight or if drainage must be built in the grading.
Pick the buffer based on your site history. If you’ve graded similar lots before, you can tighten these numbers and make your estimate sharper.
Step-by-step: your “from grading to transport” estimate worksheet
Use this step list as a quick worksheet. I’ve used versions of it for small and medium earthwork bids.
- Takeoff volume: get bank volume and split cut vs fill. Write down your units.
- Set swell and loose volume: pick a swell factor based on soil type and note it.
- Set machine production rates: measure or estimate cycle time and apply fill factor and utilization.
- Compute excavator hours: (loose or bank volume, depending on how you defined your production) ÷ m³/hour.
- Compute loader + compaction hours: treat compaction as separate work with its own pass count.
- Compute transport loads: (loose volume ÷ effective truck payload).
- Compute truck hours: loads ÷ loads per hour, then add queue/wait buffer.
- Add buffers: weather, access issues, and survey/inspection delays.
- Sanity check: compare the total day count to what’s realistic for the site layout and crew size.
How to sanity-check your estimate before you send it
Before you quote time and cost, do two quick checks. They catch the biggest mistakes without needing fancy software.
Check 1: Can the machines physically move the volume?
If your estimate says a single small machine moves 300 m³/day on a tight site with 80 m haul distance, that’s likely too optimistic. Shorten the claims until your cycle time and utilization match reality.
Check 2: Does the truck plan match the loader plan?
If your truck count is too low, the loader waits. If your truck count is too high, trucks wait and cost increases. The sweet spot is where loading can run close to continuous.
Conclusion: the takeaway that prevents budget blowups
From grading to transport: how to estimate time and cost using practical tech metrics (including equipment specs) comes down to one discipline—turn specs and field measurements into real production rates, then connect them to truck capacity with swell and waiting losses.
If you do nothing else, measure cycle time for your exact haul distance bands, apply swell correctly, and budget for idle and rework. That’s how you end up with a timeline that doesn’t surprise you two weeks later.
If you want to connect this planning approach to real project execution, check local equipment services like bobcatnuoma.eu to see how they handle earthmoving steps together. Then come back to your own metrics to confirm the production rates match your soil and access. That combination is what makes estimates reliable.
Internal links you may enjoy on our site: For more hands-on guidance, you can pair this with our GPS and survey basics for construction planning and our field tool reviews for site mapping. If your project touches connected devices or contractor networks, our cybersecurity checklist for contractor job sites can help keep planning files and scan data safe.